BACK
Revenue announcement
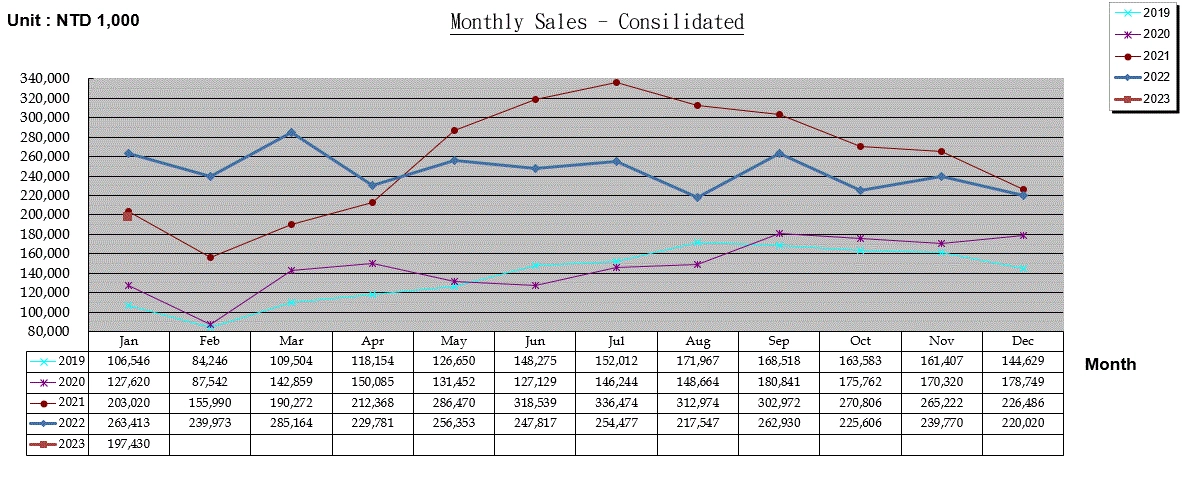
MONTHLY SALES INFORMATION
2022 MONTHLY REVENUE
UNIT NTD: THOUSAND DOLLARS
| Month | Net operating income | Cumulative net revenue for the year | Increase/decrease ratio for the same period last year | Cumulative increase and decrease ratio for the same period last year |
|---|---|---|---|---|
| January | 263,413 | 263,413 | 29.75 % | 29.75 % |
| February | 239,973 | 503,386 | 53.84 % | 40.22% |
| March | 285,164 | 788,550 | 49.87 % | 43.56% |
| April | 229,781 | 1,018,331 | 8.20% | 33.70 % |
| May | 256,353 | 1,274,684 | -10.51 % | 21.62 % |
| June | 247,817 | 1,522,501 | -22.20 % | 11.40 % |
| July | 254,477 | 1,776,978 | -24.37 % | 4.34 % |
| August | 217,547 | 1,994,525 | -30.49% | -1.07 % |
| September | 262,930 | 2,257,455 | -13.22 % | -2.66% |
| October | 222,500 | 2,479,955 | -17.84 % | -4.24 % |
| November | - | 2,479,655 | -100% | -13.14 % |
| December | - | 2,479,655 | -100% | -19.52 % |
PUBLIC OBSERVATION WEBSITE
MONTHLY SALES CHART FOR LAST 5YEARS